Last updated at April 16, 2024 by Teachoo
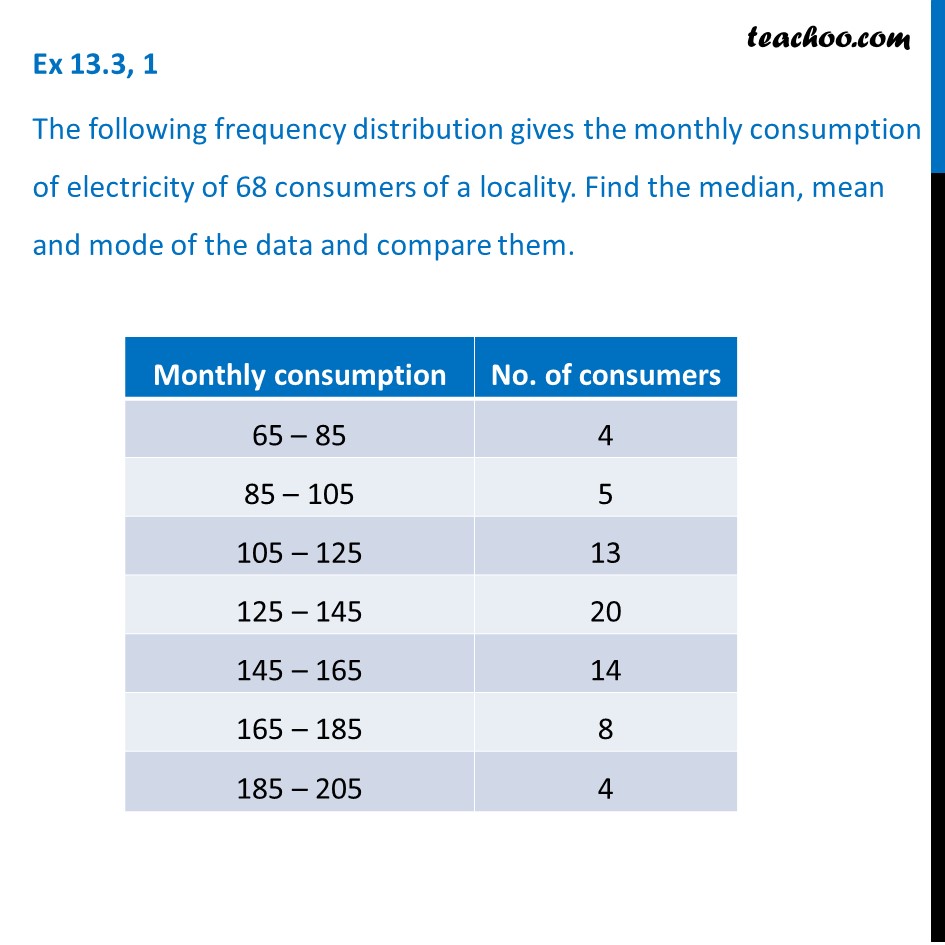
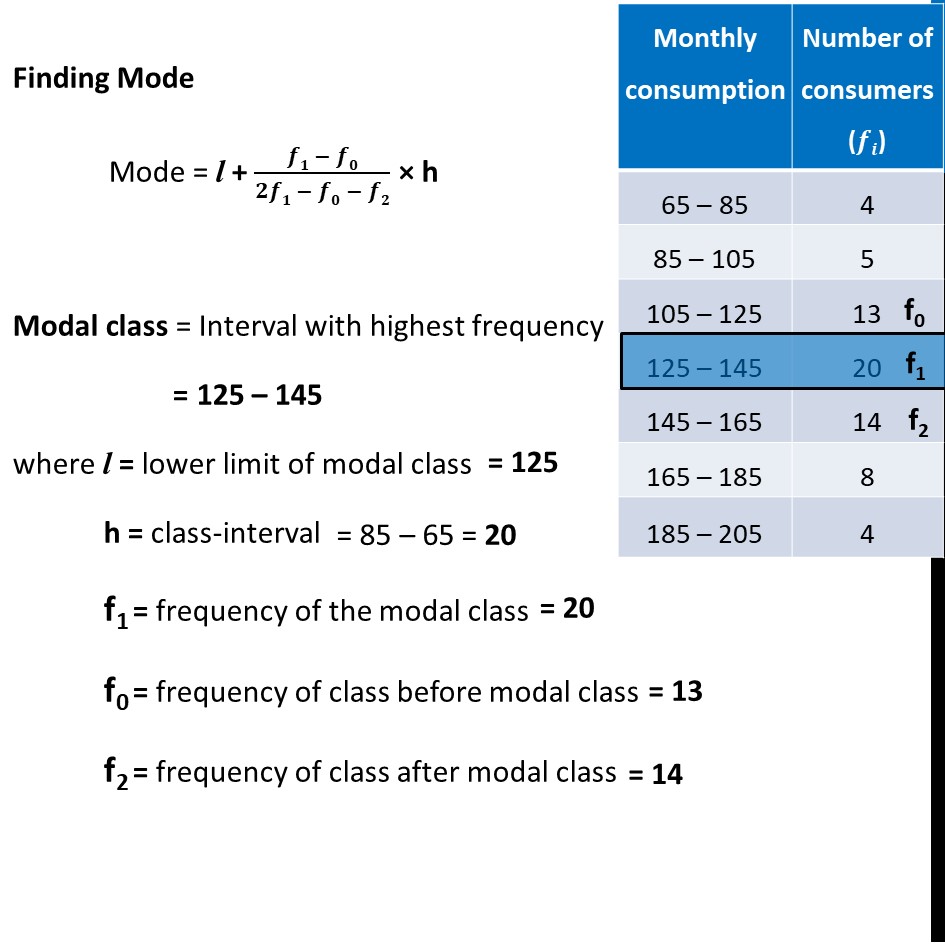
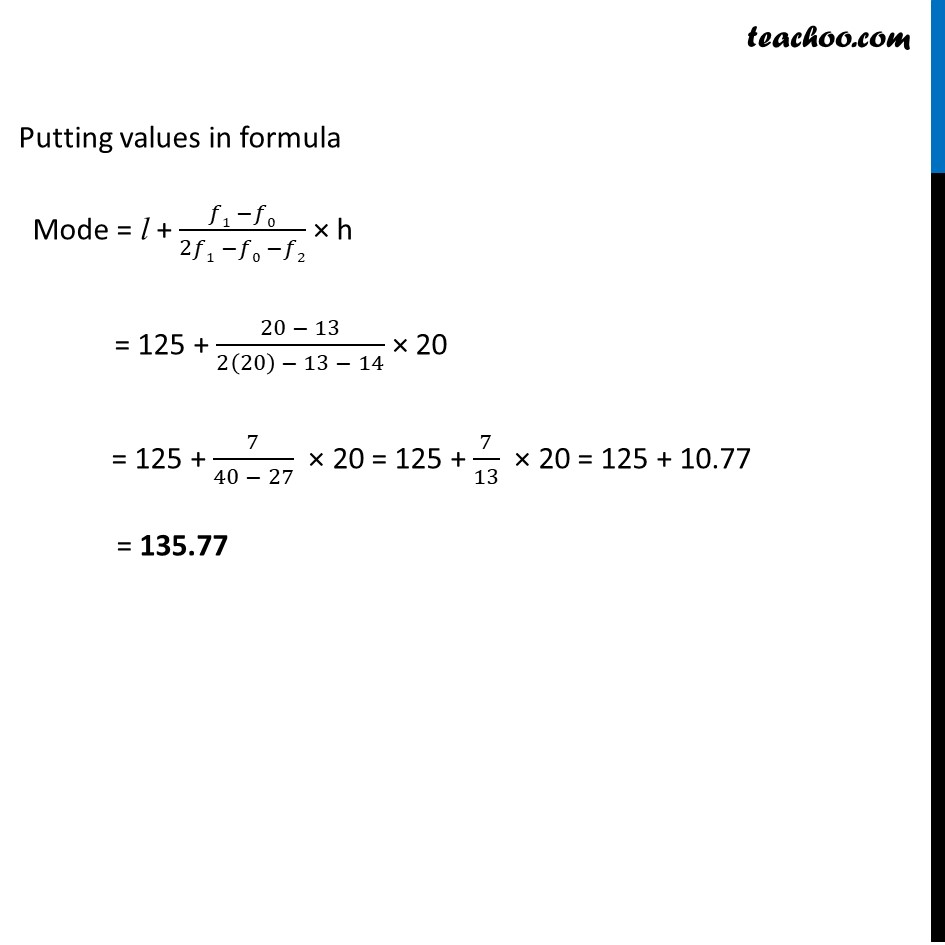
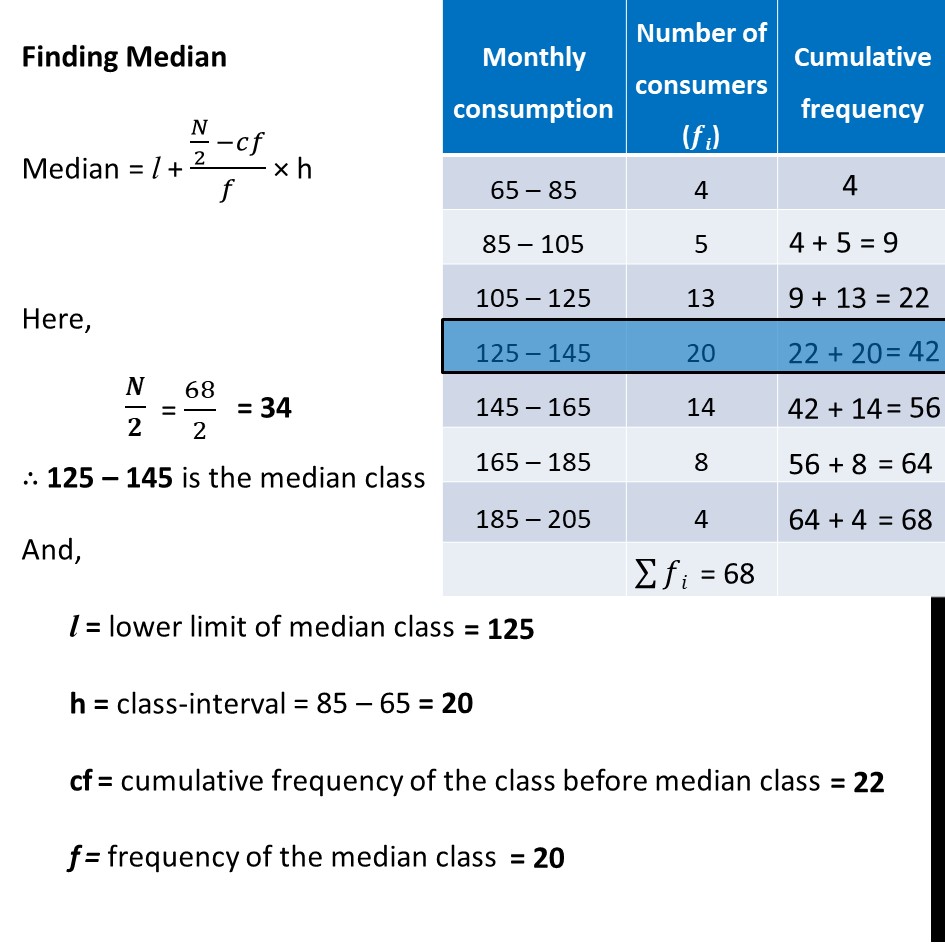
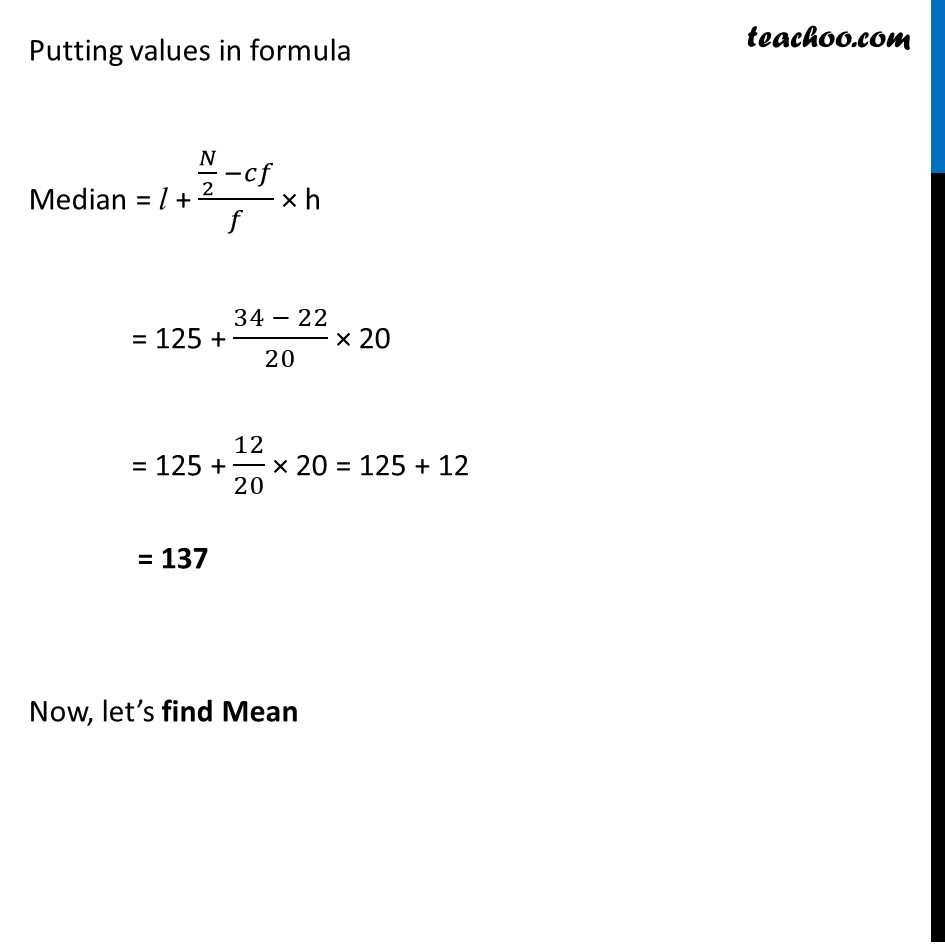
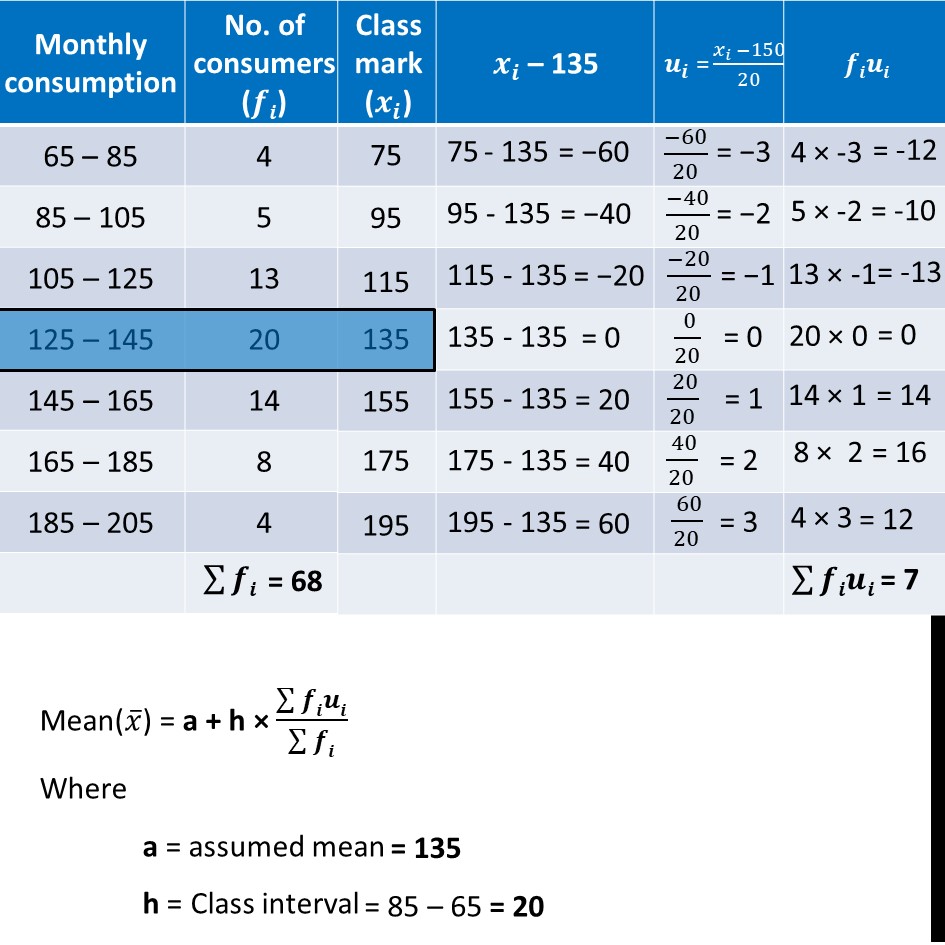
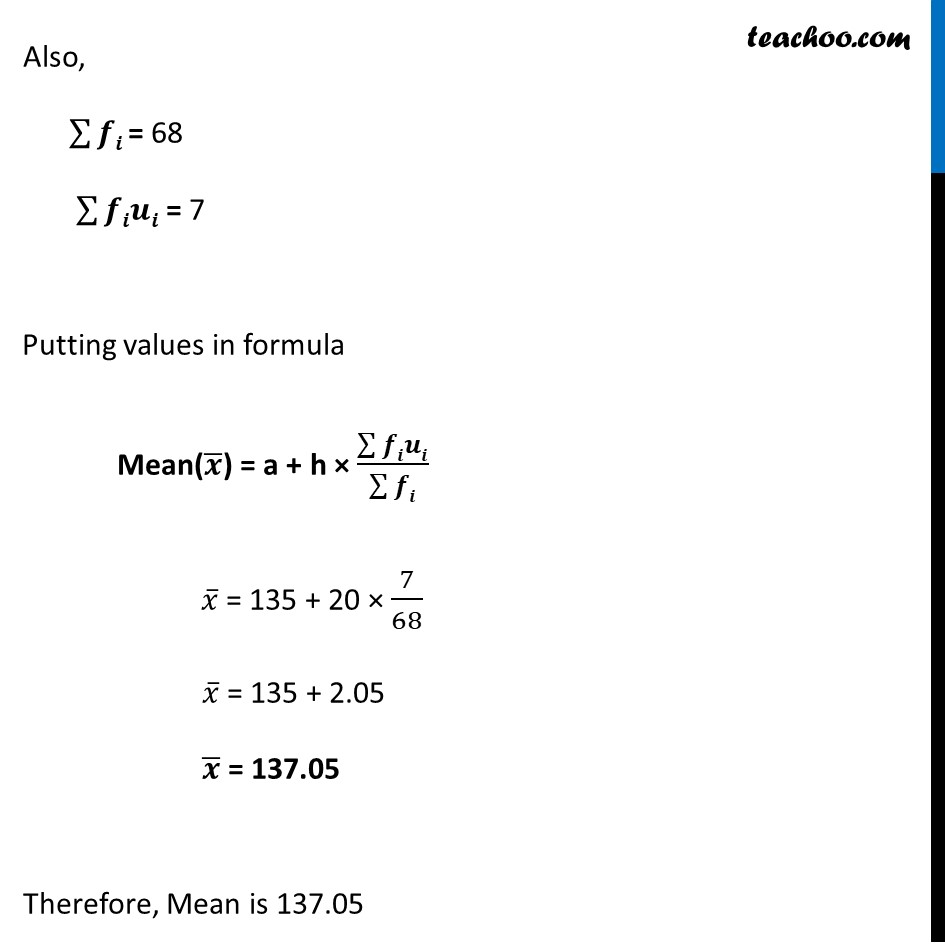
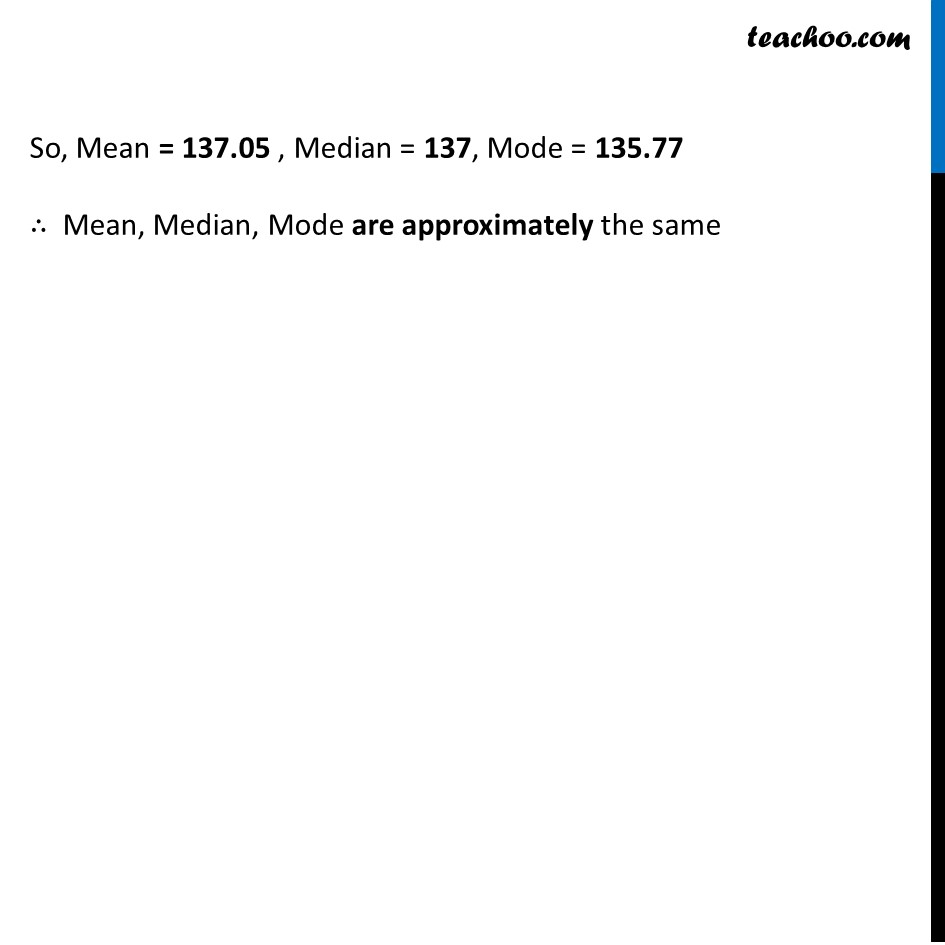
Ex 13.3, 1 The following frequency distribution gives the monthly consumption of electricity of 68 consumers of a locality. Find the median, mean and mode of the data and compare them. Finding Mode Mode = l + (𝒇𝟏 − 𝒇𝟎)/(𝟐𝒇𝟏 − 𝒇𝟎 − 𝒇𝟐) × h Modal class = Interval with highest frequency = 125 – 145 where l = lower limit of modal class h = class-interval f1 = frequency of the modal class f0 = frequency of class before modal class f2 = frequency of class after modal class Putting values in formula Mode = l + (𝑓1 −𝑓0)/(2𝑓1 −𝑓0 −𝑓2) × h = 125 + (20 − 13)/(2(20) − 13 − 14) × 20 = 125 + 7/(40 − 27) × 20 = 125 + 7/13 × 20 = 125 + 10.77 = 135.77 Finding Median Median = l + (𝑁/2 −𝑐𝑓)/𝑓 × h Here, 𝑵/𝟐 ∴ 125 – 145 is the median class And, l = lower limit of median class h = class-interval cf = cumulative frequency of the class before median class f = frequency of the median class Putting values in formula Median = l + (𝑁/2 −𝑐𝑓)/𝑓 × h = 125 + (34 − 22)/20 × 20 = 125 + 12/20 × 20 = 125 + 12 = 137 Now, let’s find Mean Mean(𝑥 ̅) = a + h × (∑▒𝒇𝒊𝒖𝒊)/(∑▒𝒇𝒊) Where a = assumed mean h = Class interval Also, ∑▒𝒇𝒊 = 68 ∑▒𝒇𝒊𝒖𝒊 = 7 Putting values in formula Mean(𝒙 ̅) = a + h × (∑▒𝒇𝒊𝒖𝒊)/(∑▒𝒇𝒊) 𝑥 ̅ = 135 + 20 × 7/68 𝑥 ̅ = 135 + 2.05 𝒙 ̅ = 137.05 Therefore, Mean is 137.05 So, Mean = 137.05 , Median = 137, Mode = 135.77 ∴ Mean, Median, Mode are approximately the same
