You are learning...
Updated for NCERT 2023-24 Edition.
Get solutions of Chapter 13 Class 11 Statistics of free at teachoo. Answers to all NCERT questions and examples are solved in a step-by-step basis, with detailed explanations of each and every question.
In previous classes, we learned what data is, what mean, median, mode is.
Mean, median, mode are called central tendency. In this chapter, we will find dispersion. Dispersion means how the data is different from the central tendency. Like if we find mean, how the data is different from the mean.
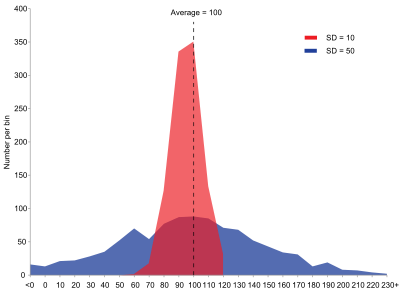
Like in the figure

Both red and blue graphs have the same mean - 100.
We see that values of the blue graph are very left and right from the mean, that is, they are dispersed from the mean.
And, for the red graph, they are very close to the mean, they are less dispersed from the mean.
This is called Dispersion.
In this chapter, we will study how do we find dispersion.
The topics in the chapter include
- How to find range
- Finding Mean deviation about Mean for
- Ungrouped data
- Grouped data - Discrete frequency deviation and Continuous Frequency Deviation
- And, we will also find Mean deviation about Median for ungrouped and grouped data
- (In Mean Deviation about Mean and Median, we will use the concepts of finding Mean and Median from Class 10 Statistics)
- Then, we study another form of dispersion, known as Standard Deviation and Variance.
- We will learn formulas of Standard Deviation for Discrete Frequency Distribution, Continuous Frequency Distribution and shortcut method as well.
- Then, to compare two groups of numbers, we find Coefficient of Variation.
- And we also do some mix questions like Multiplication of observations, Finding remaining observations, Correcting incorrect observations.
Let's start by clicking on a topic or an exercise. Start now
Serial order wise
Concept wise
What's in it?
Updated for NCERT 2023-24 Edition.
Get solutions of Chapter 13 Class 11 Statistics of free at teachoo. Answers to all NCERT questions and examples are solved in a step-by-step basis, with detailed explanations of each and every question.
In previous classes, we learned what data is, what mean, median, mode is.
Mean, median, mode are called central tendency. In this chapter, we will find dispersion. Dispersion means how the data is different from the central tendency. Like if we find mean, how the data is different from the mean.
Like in the figure

Both red and blue graphs have the same mean - 100.
We see that values of the blue graph are very left and right from the mean, that is, they are dispersed from the mean.
And, for the red graph, they are very close to the mean, they are less dispersed from the mean.
This is called Dispersion.
In this chapter, we will study how do we find dispersion.
The topics in the chapter include
- How to find range
- Finding Mean deviation about Mean for
- Ungrouped data
- Grouped data - Discrete frequency deviation and Continuous Frequency Deviation
- And, we will also find Mean deviation about Median for ungrouped and grouped data
- (In Mean Deviation about Mean and Median, we will use the concepts of finding Mean and Median from Class 10 Statistics)
- Then, we study another form of dispersion, known as Standard Deviation and Variance.
- We will learn formulas of Standard Deviation for Discrete Frequency Distribution, Continuous Frequency Distribution and shortcut method as well.
- Then, to compare two groups of numbers, we find Coefficient of Variation.
- And we also do some mix questions like Multiplication of observations, Finding remaining observations, Correcting incorrect observations.
Let's start by clicking on a topic or an exercise. Start now