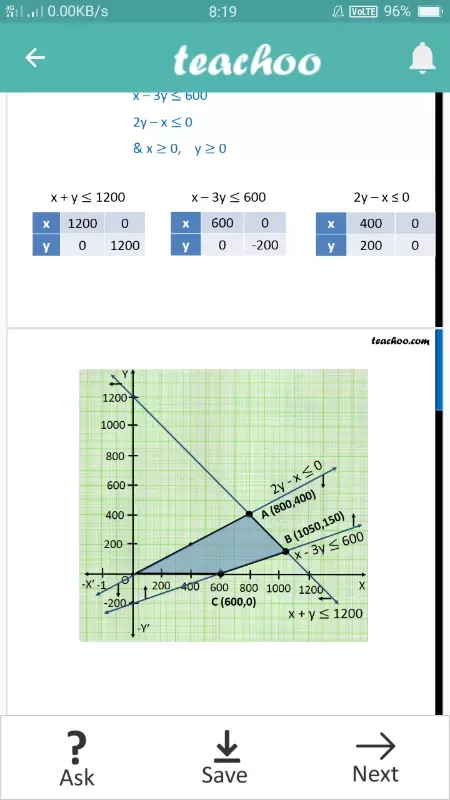
(x-3y<600 )in this equation this is the true condition so why it is drawn above in the graph
I think this can be drawn below in graph

(x-3y<600 )in this equation this is the true condition so why it is drawn above in the graph
I think this can be drawn below in graph
Hello Rahul
For x - 3y <= 600,
Let us take two points
For (0, 0)
0 - 3(0) <= 600
0 - 0 <= 600
0 <= 600
Which is true.
So, we mark the region where (0, 0) lies. That is upwards
For (400, 200)
This point is directly above the line
400 - 3(200) <= 600
400 - 600 <= 600
-200 <= 600
Which is true.
So, we mark the region where (400, 200) lies. That is upwards